Hybrid objective model (IDOCRIW-CoCoSo) optimizes groundwater potential
Published:
Description
Published work - Cleaner Water (2026). Link
Highlights
Integrated Determination of Objective Criteria Weights-Combined Compromise Solution (IDOCRIW-CoCoSo) multi-criteria decision-making approach have been employed to model groundwater potential of the area.
Integration of Remote sensing and geophysical datasets proved effective for the modelling.
Comparative analysis with objective models (CRITIC-CoCoSo, and Mean Weighted CoCoSo) ensured confidence in the adopted approach.
Abstract
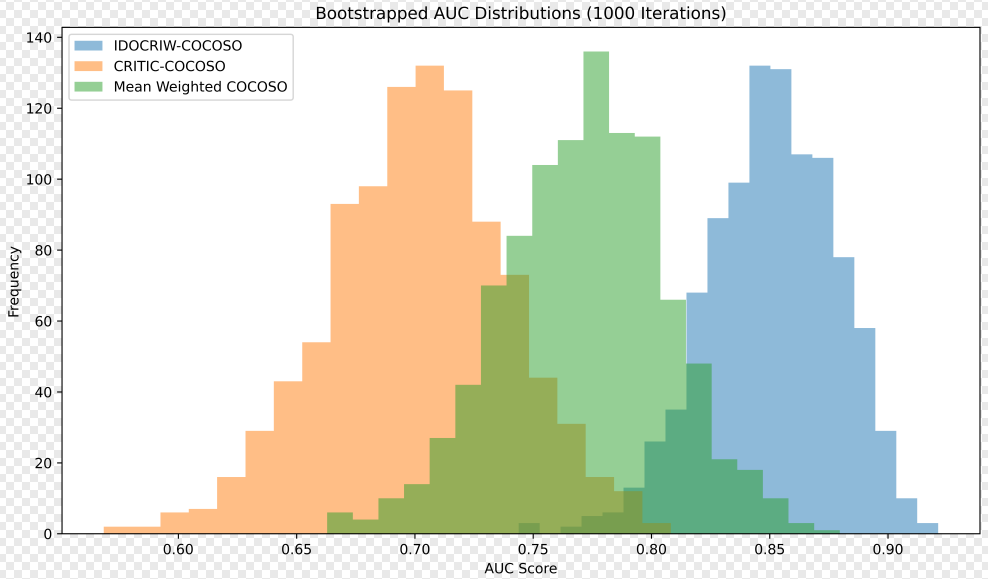
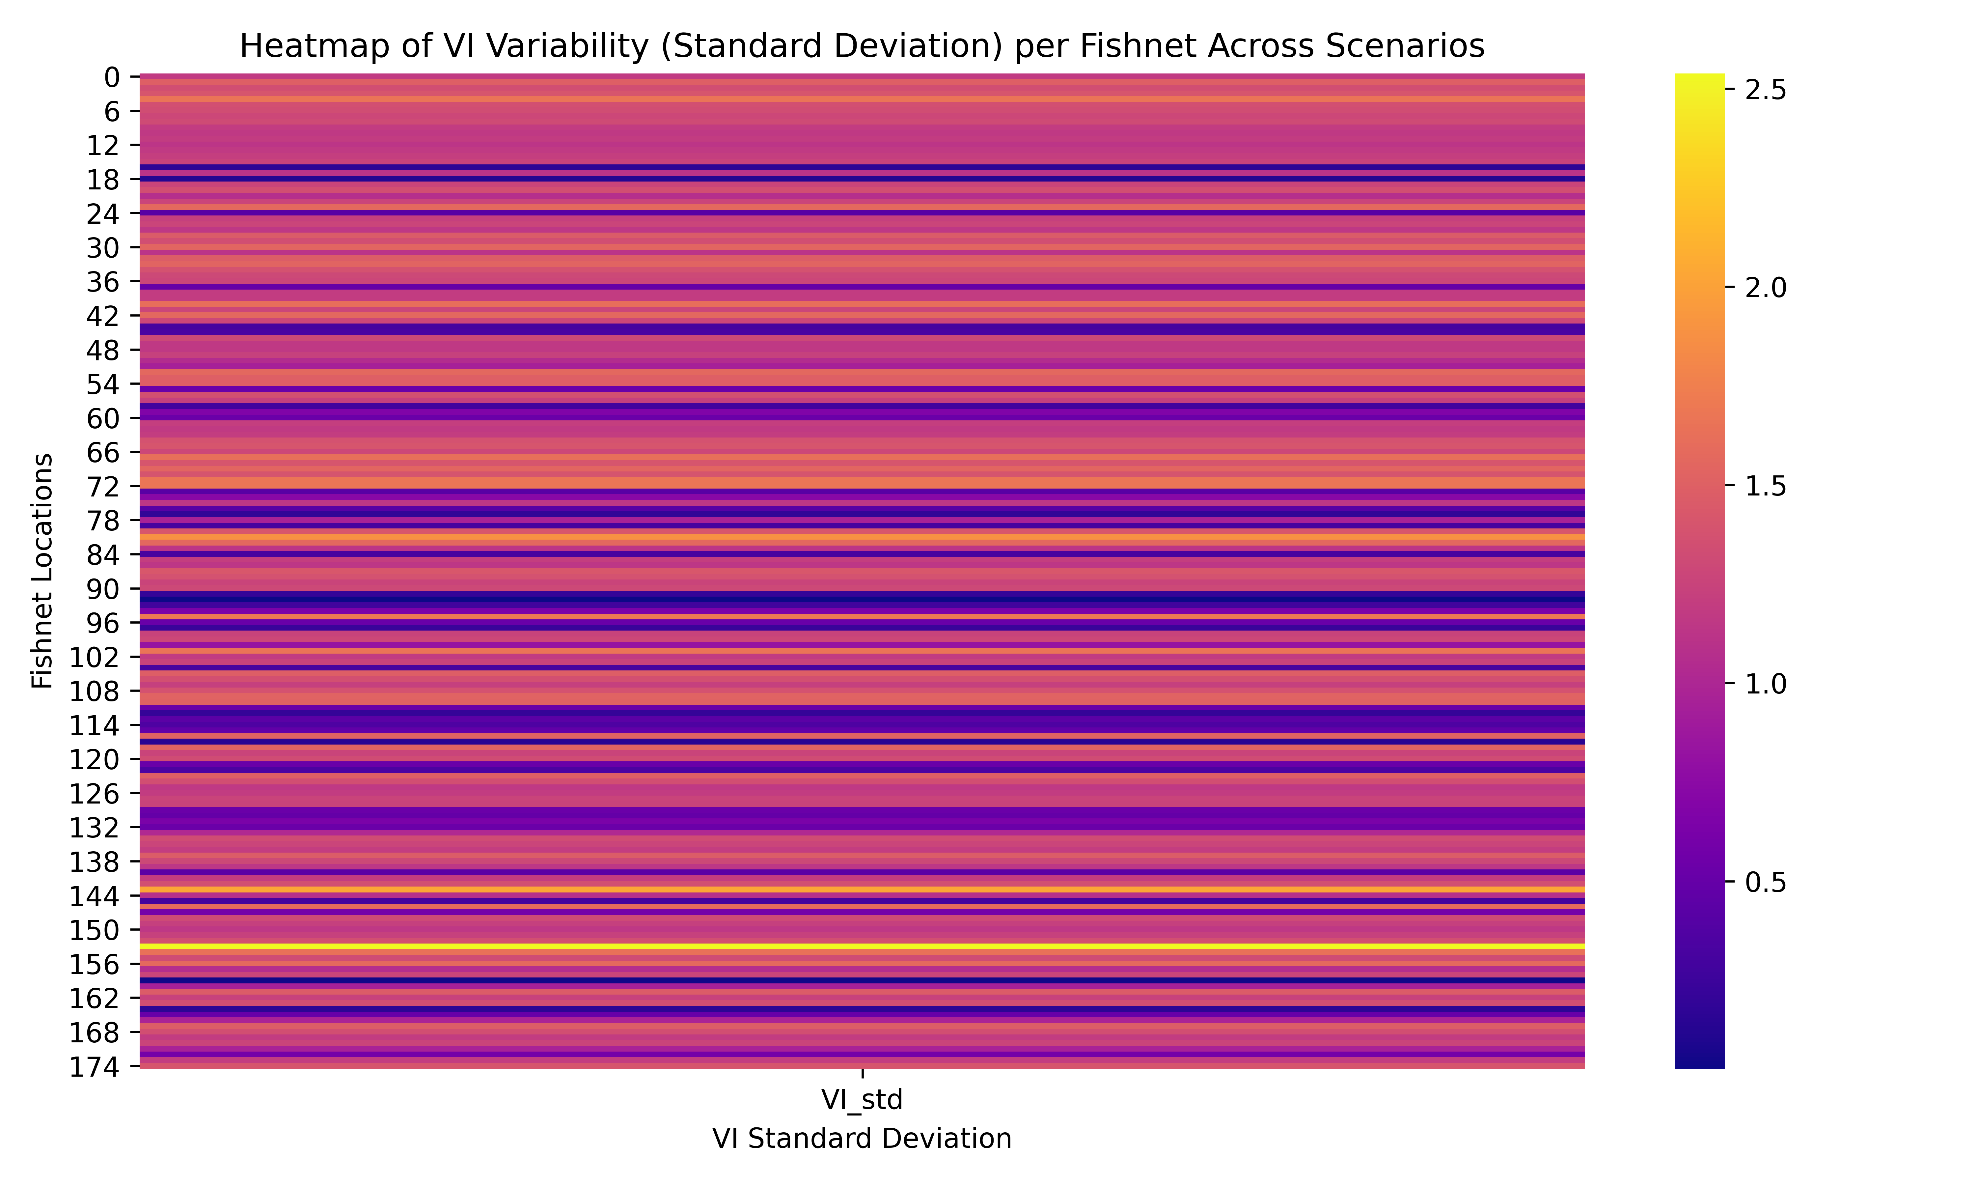
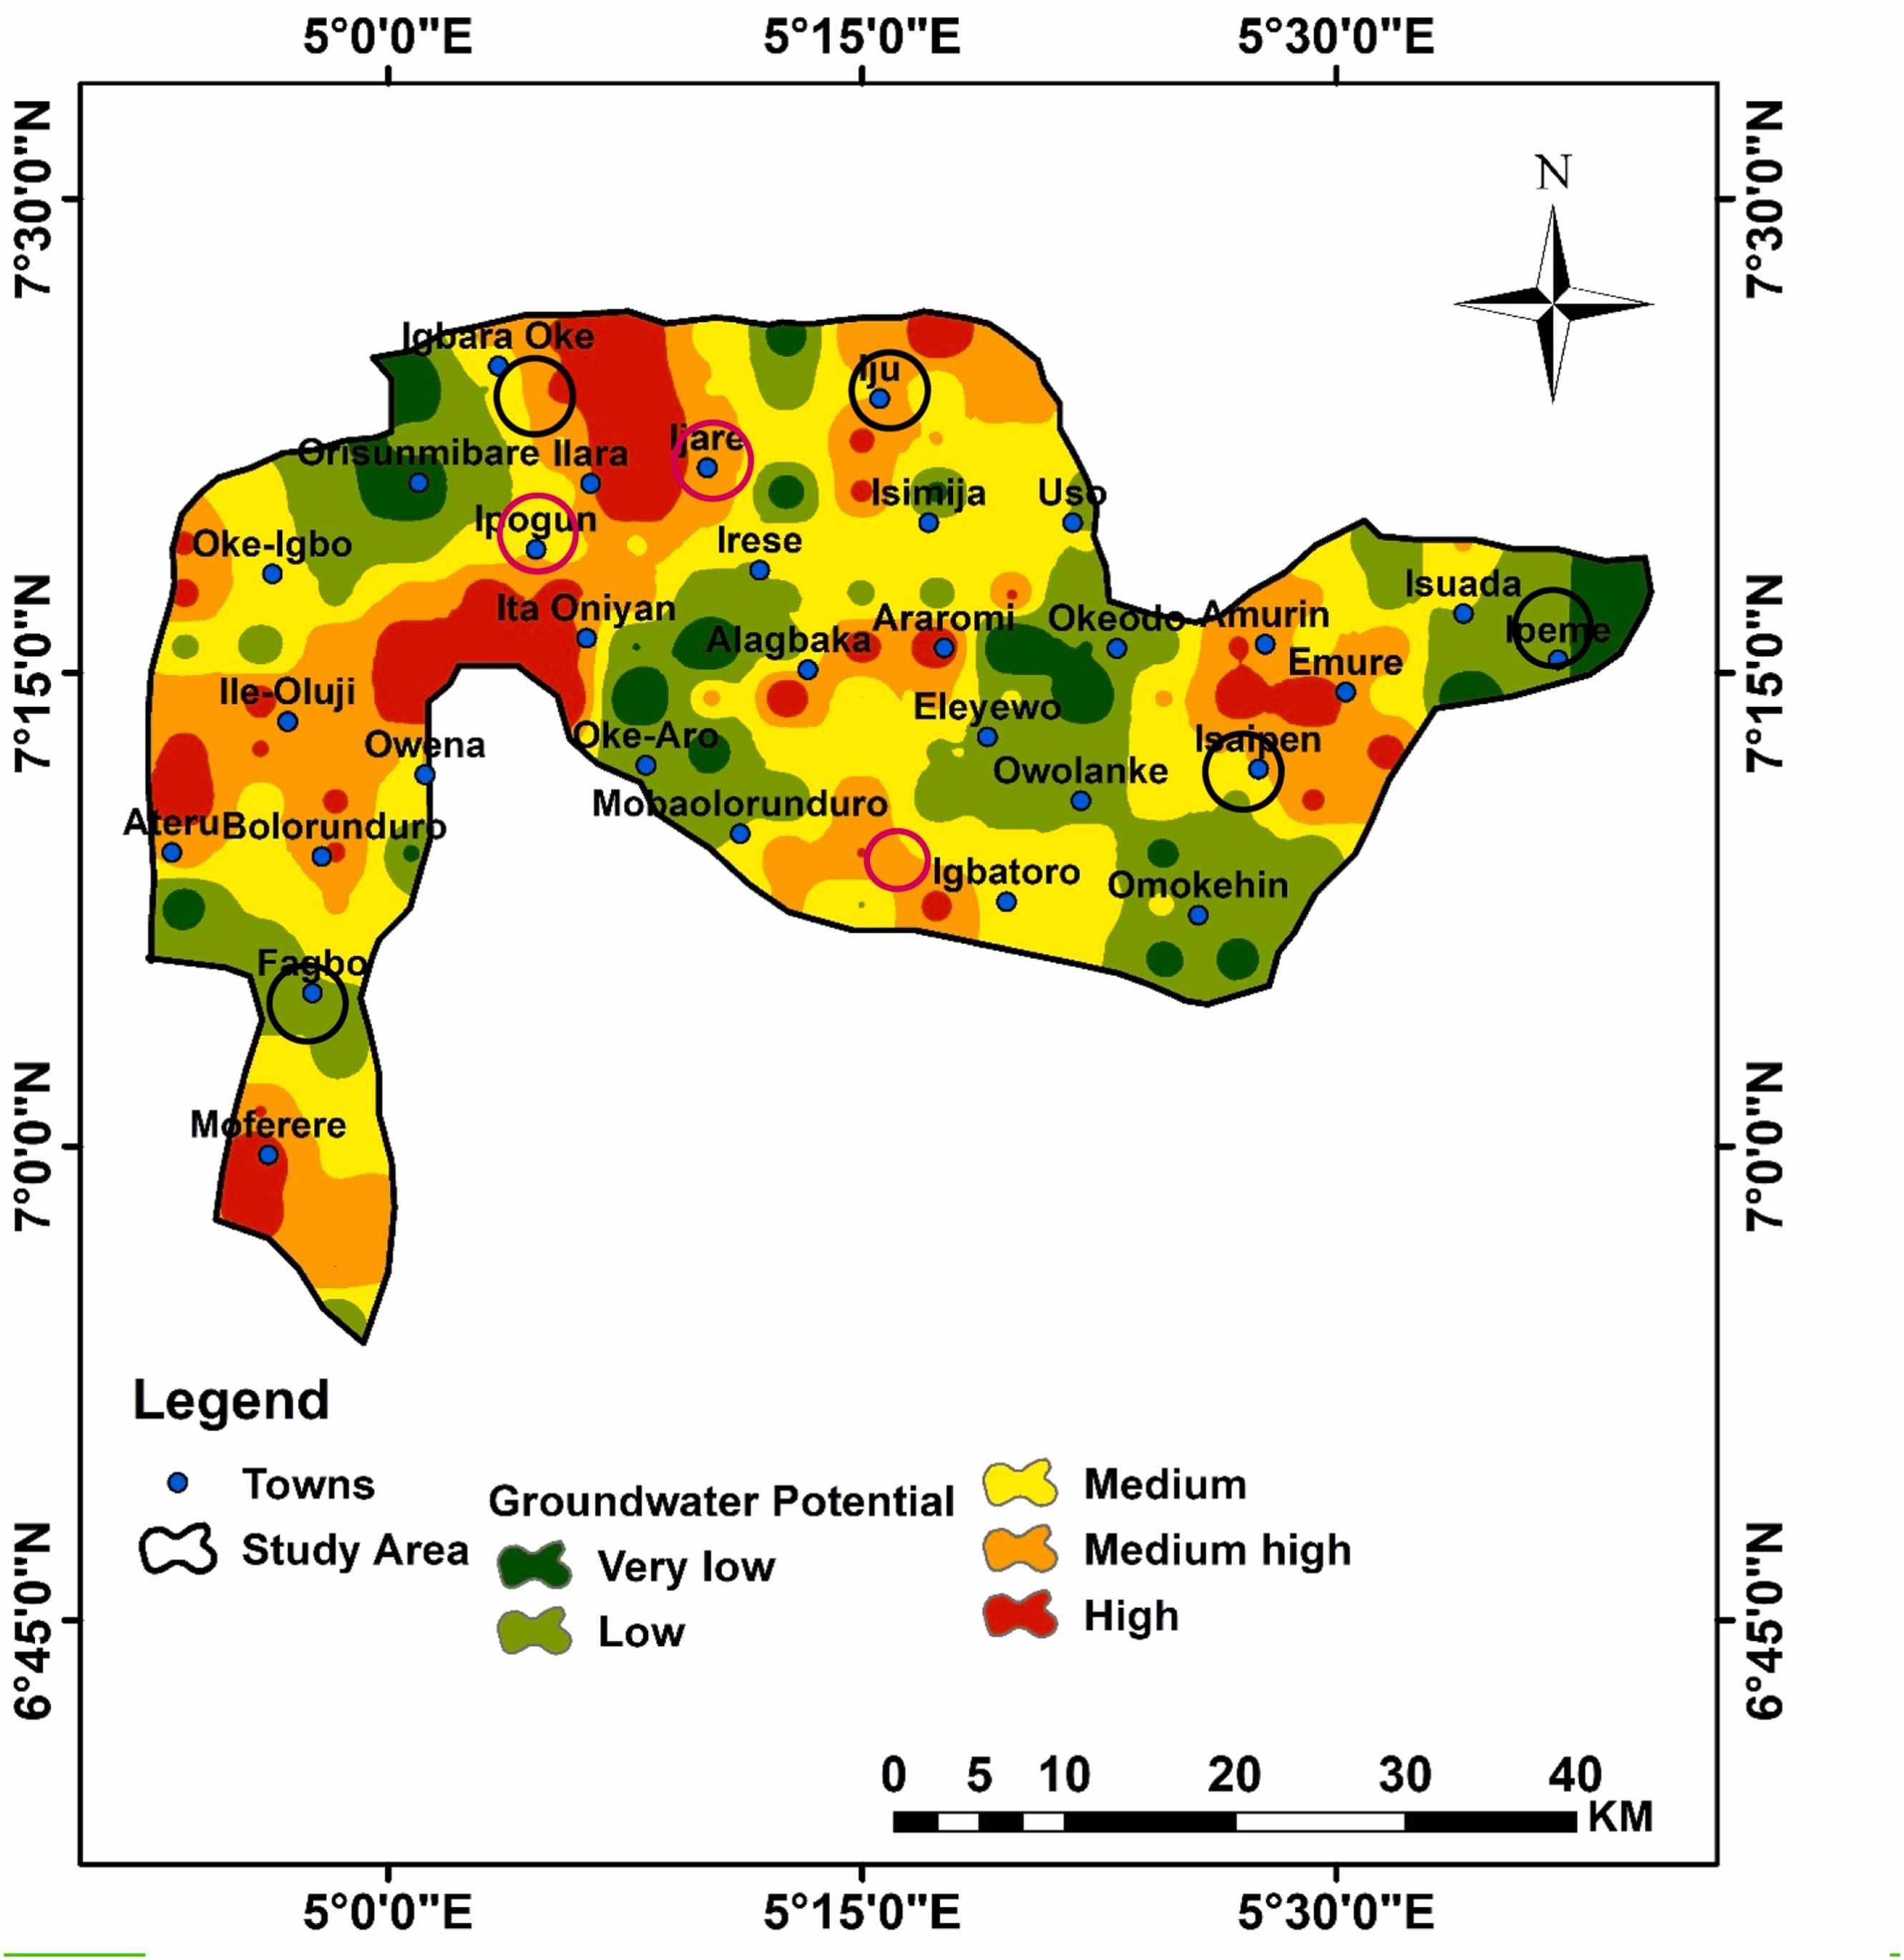
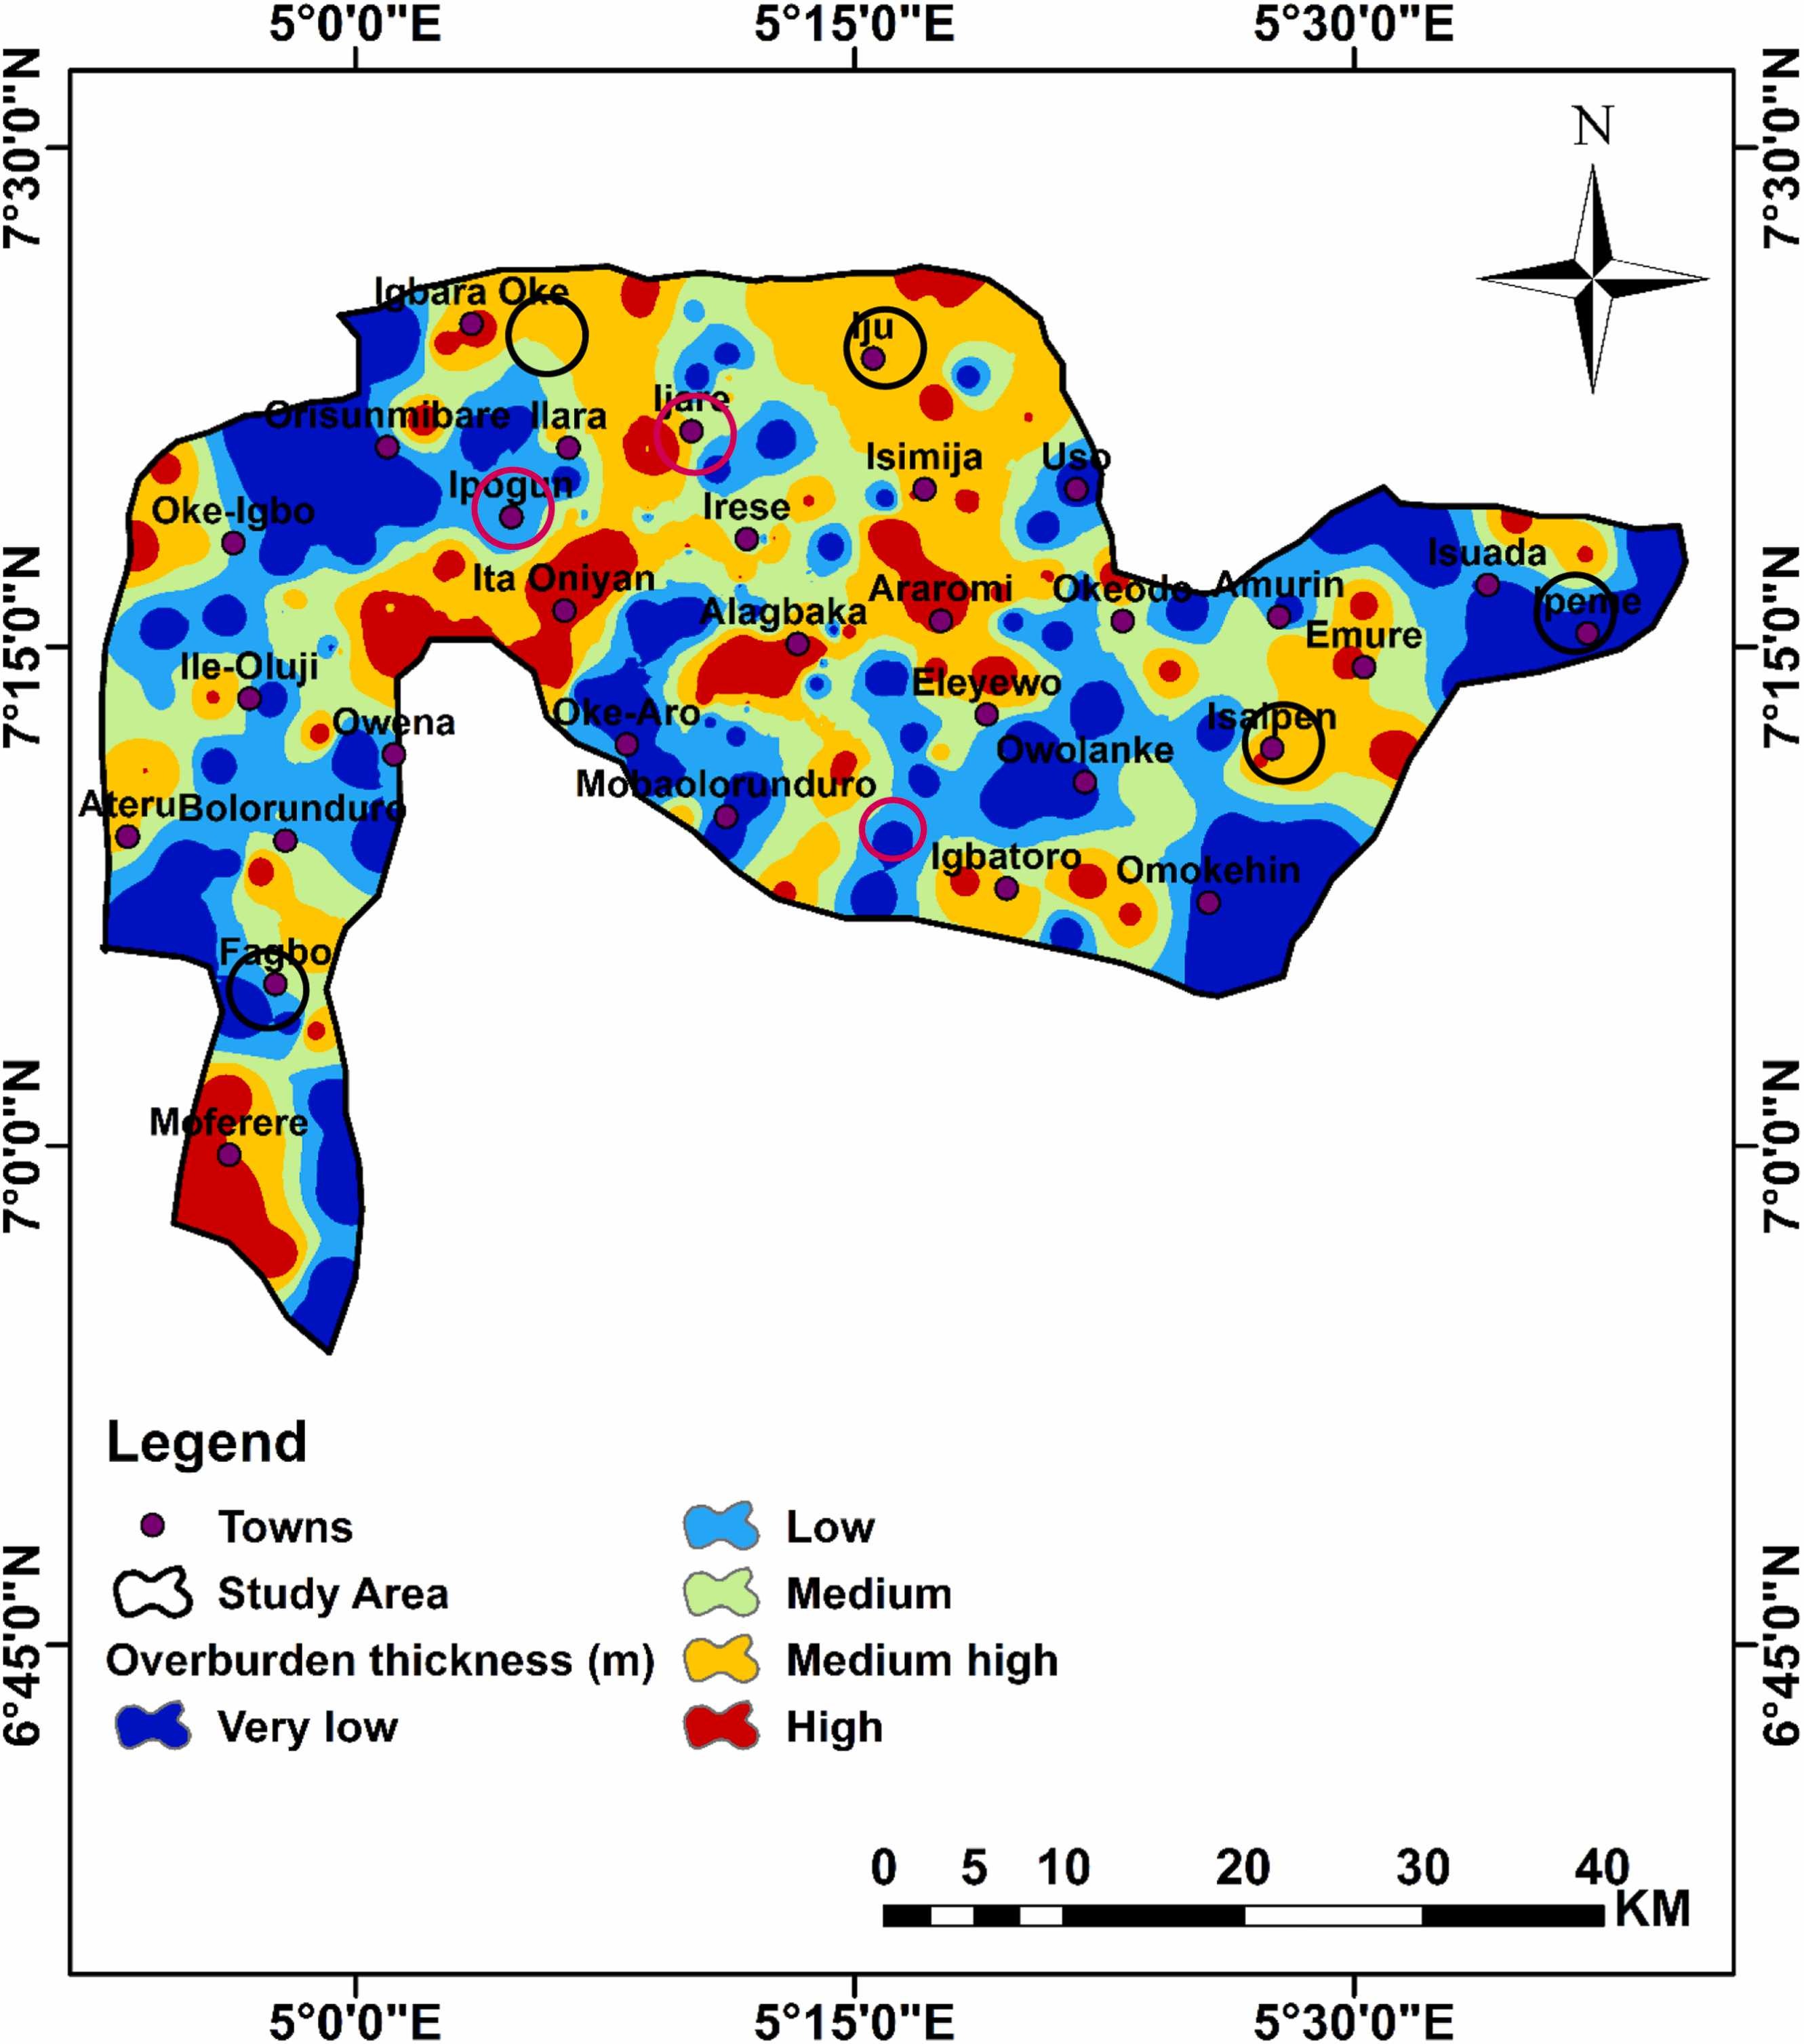
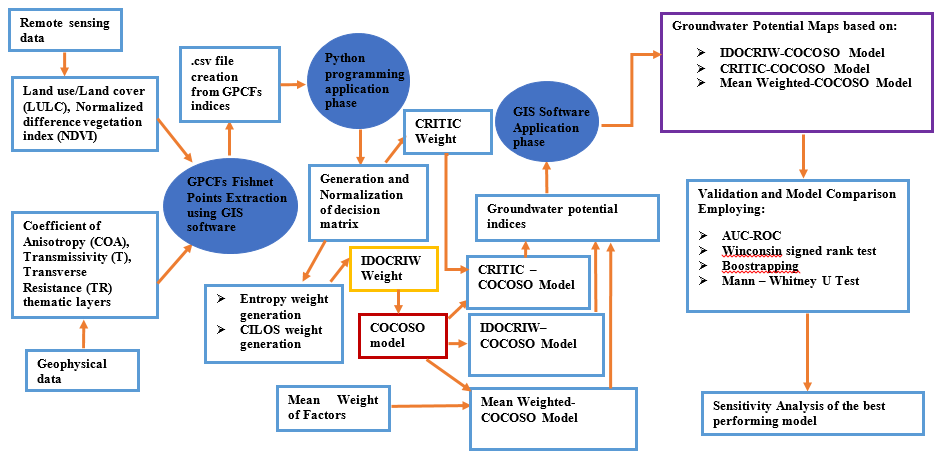
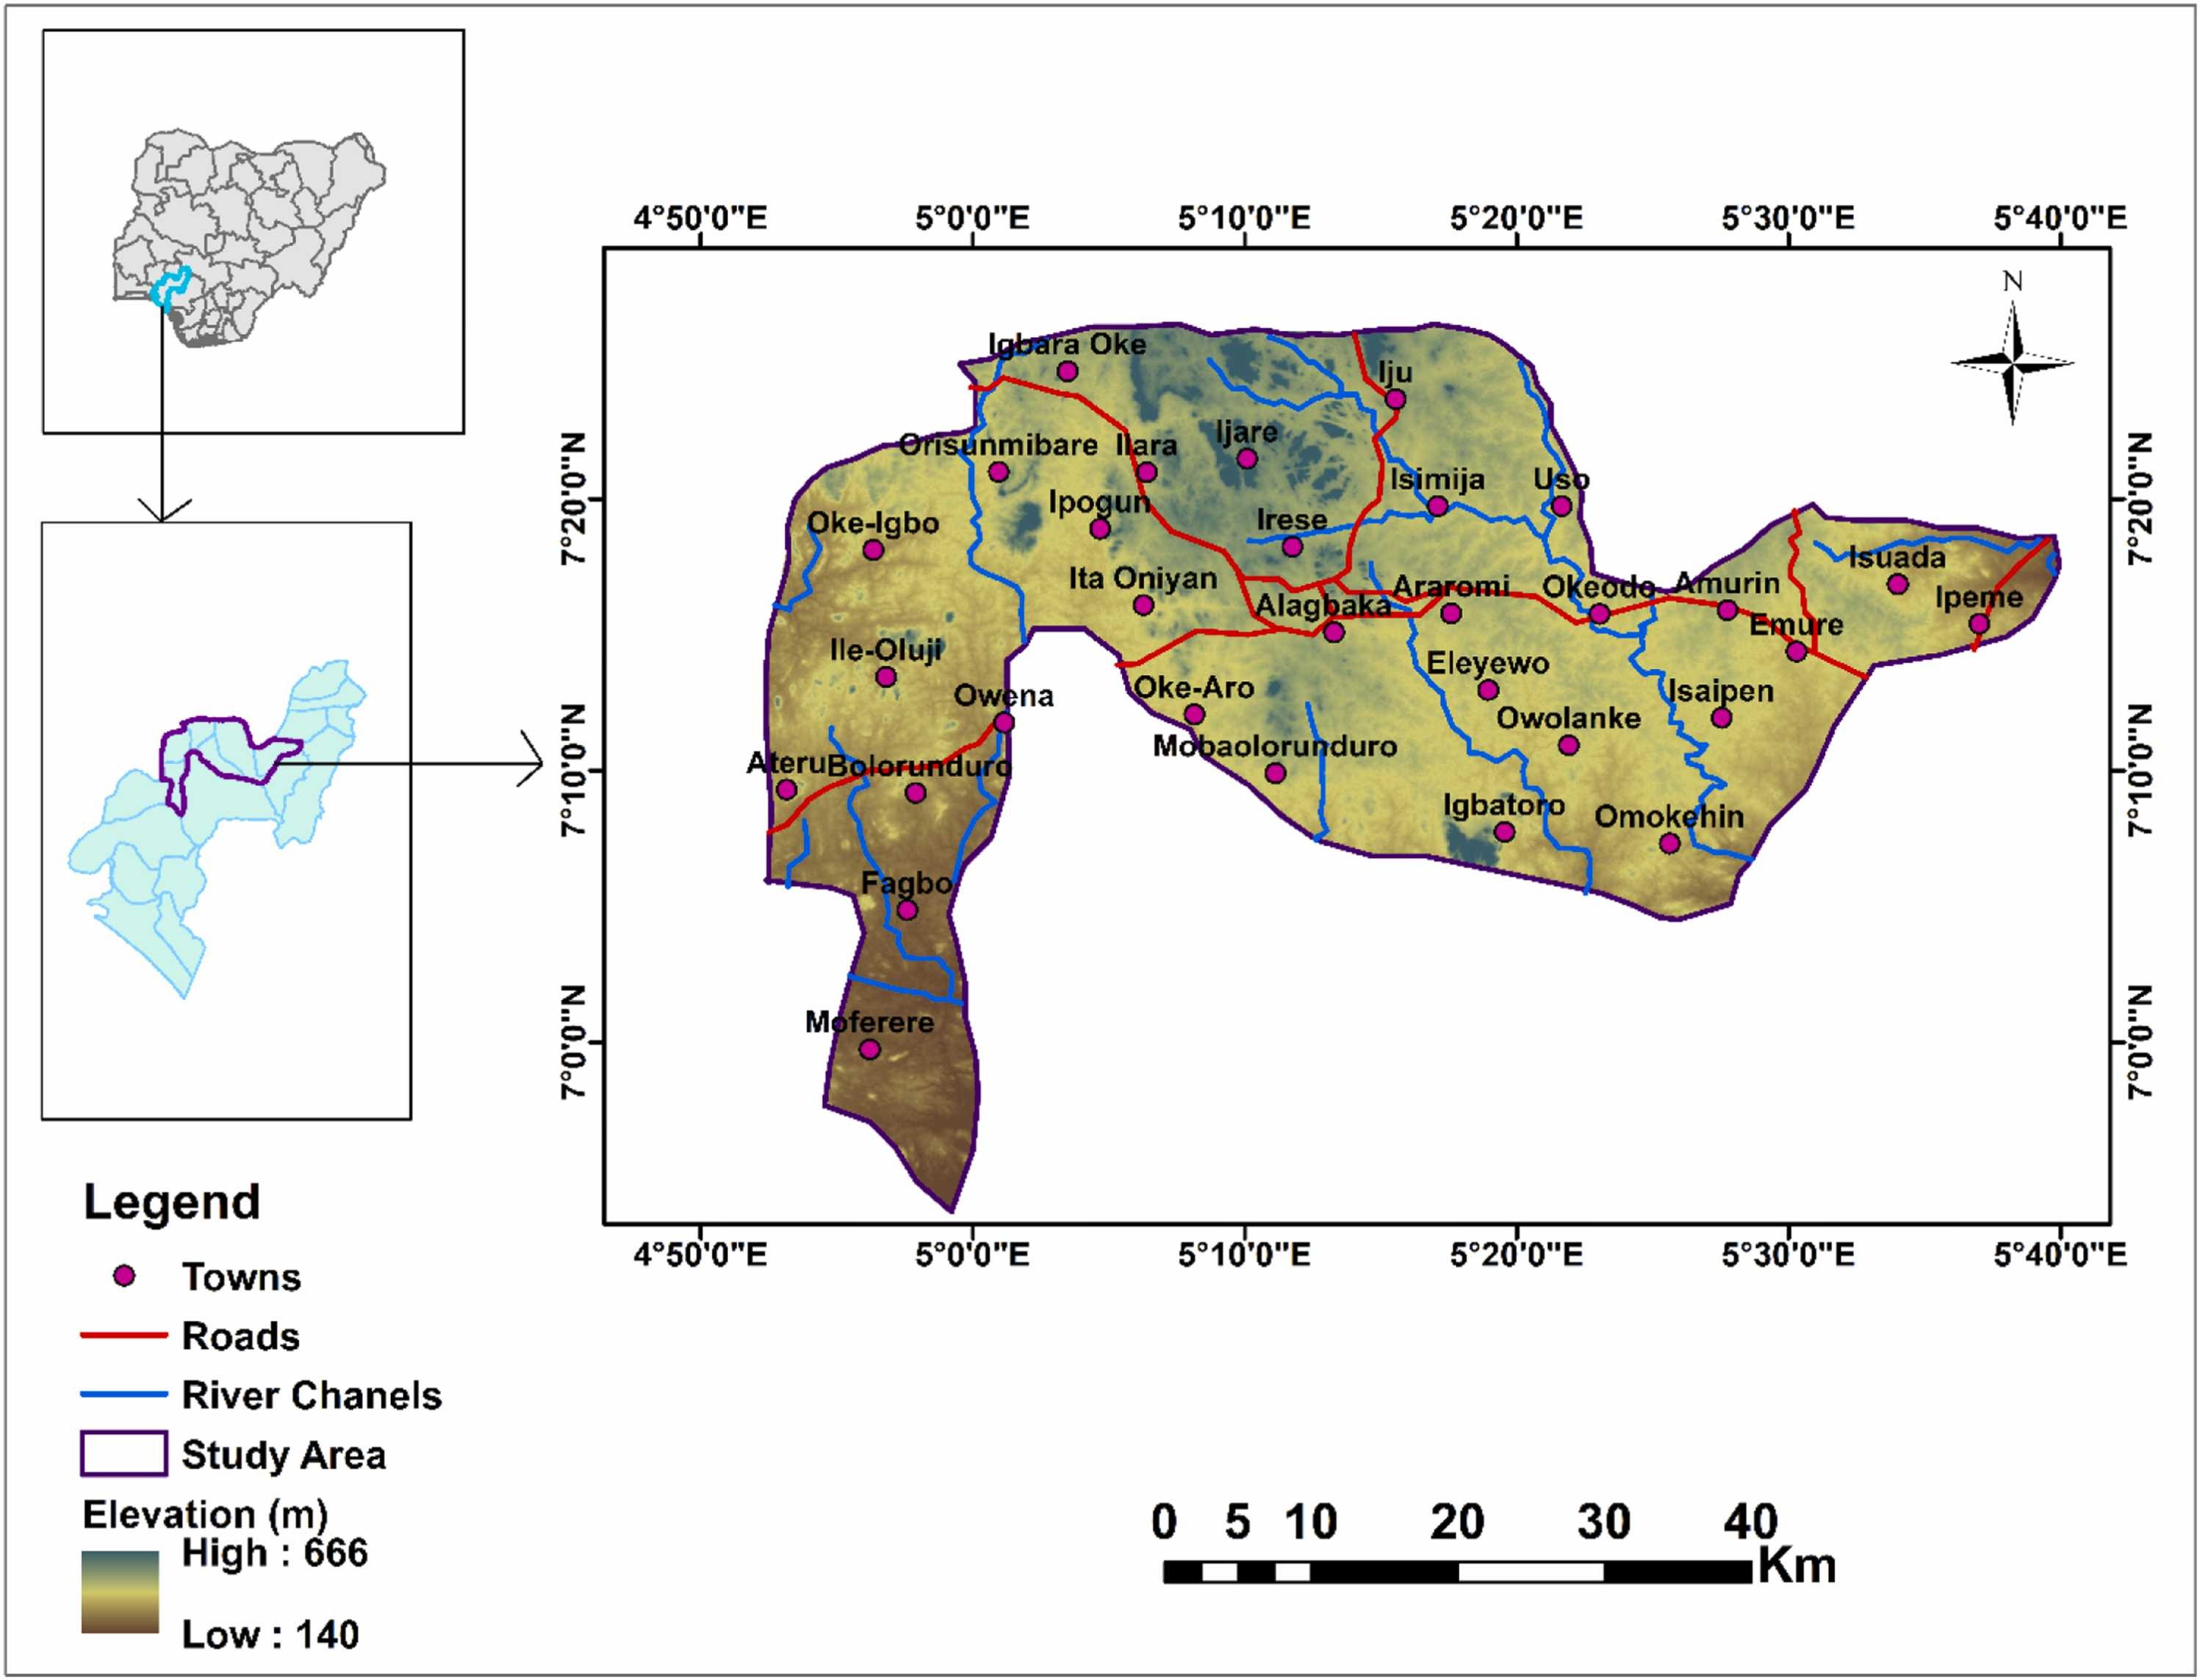
Groundwater is a valuable asset in both urban and rural areas, where the demand for alternate water sources is increasing—a vital resource for agriculture, industry, and domestic. Assessment of this resource becomes paramount globally and especially in areas where fresh water demand is rising despite falling within a multi-faceted geologic environment—rendering its sustainable management a pressing concern. To address this issue, an Integrated Determination of Objective CRIteria weights–Combined Compromise Solution (IDOCRIW-CoCoSo) was developed by integrating five groundwater potential influencing factors sourced from remote sensing and geophysical datasets. This will increase the prospect of finding productive aquifers and maximize the choice of drilling sites. The results were contrasted with two other hybrid objective modelling approaches, including CRiteria Importance Through Intercriteria Correlation–Combined Compromise Solution (CRITIC-CoCoSo), and Mean Weighted (MW) - CoCoSo. The groundwater potential map produced, classified into five classes, showed that 6% (113 km²), 26% (486 km²), 32% (603 km²), 26% (473 km²), and 10% (192 km²) fall into very low, low, medium, medium high, and high potentiality, respectively. The obtained results were confirmed using the receiver operating characteristic (ROC) curve and sensitivity analysis. According to the area under the ROC curve, the IDOCRIW-CoCoSo had a success rate of 83%, compared to MW- CoCoSo with an area under the curve (AUC) of 75% and CRITIC-CoCoSo (69%). The findings demonstrate IDOCRIW-CoCoSo’s higher accuracy in predicting groundwater potential zones. For the sustained development and management of water-scarce areas, this study offers scientific perspective into the sustainability, distribution and governance of groundwater assets.
Methodology
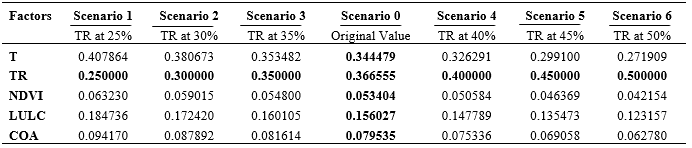
Conditioning factors maps have been generated using ArcGIS 10.8.2 software. Python programming coded objective models were applied to the groundwater potential decision matrix gotten through fishnet points extraction of pixel values from the factors maps. Interpolation technique was used to create groundwater potential maps of the study area taking groundwater potential indices from models as input. Several reliability and comparative analysis iincluding sensitivity analysis as well as multicollinearity testing were adopted.
Findings
The produced groundwater potential map (IDOCRIW-CoCoSo) is advantageous in meeting SDG 6.1 goals in the study area
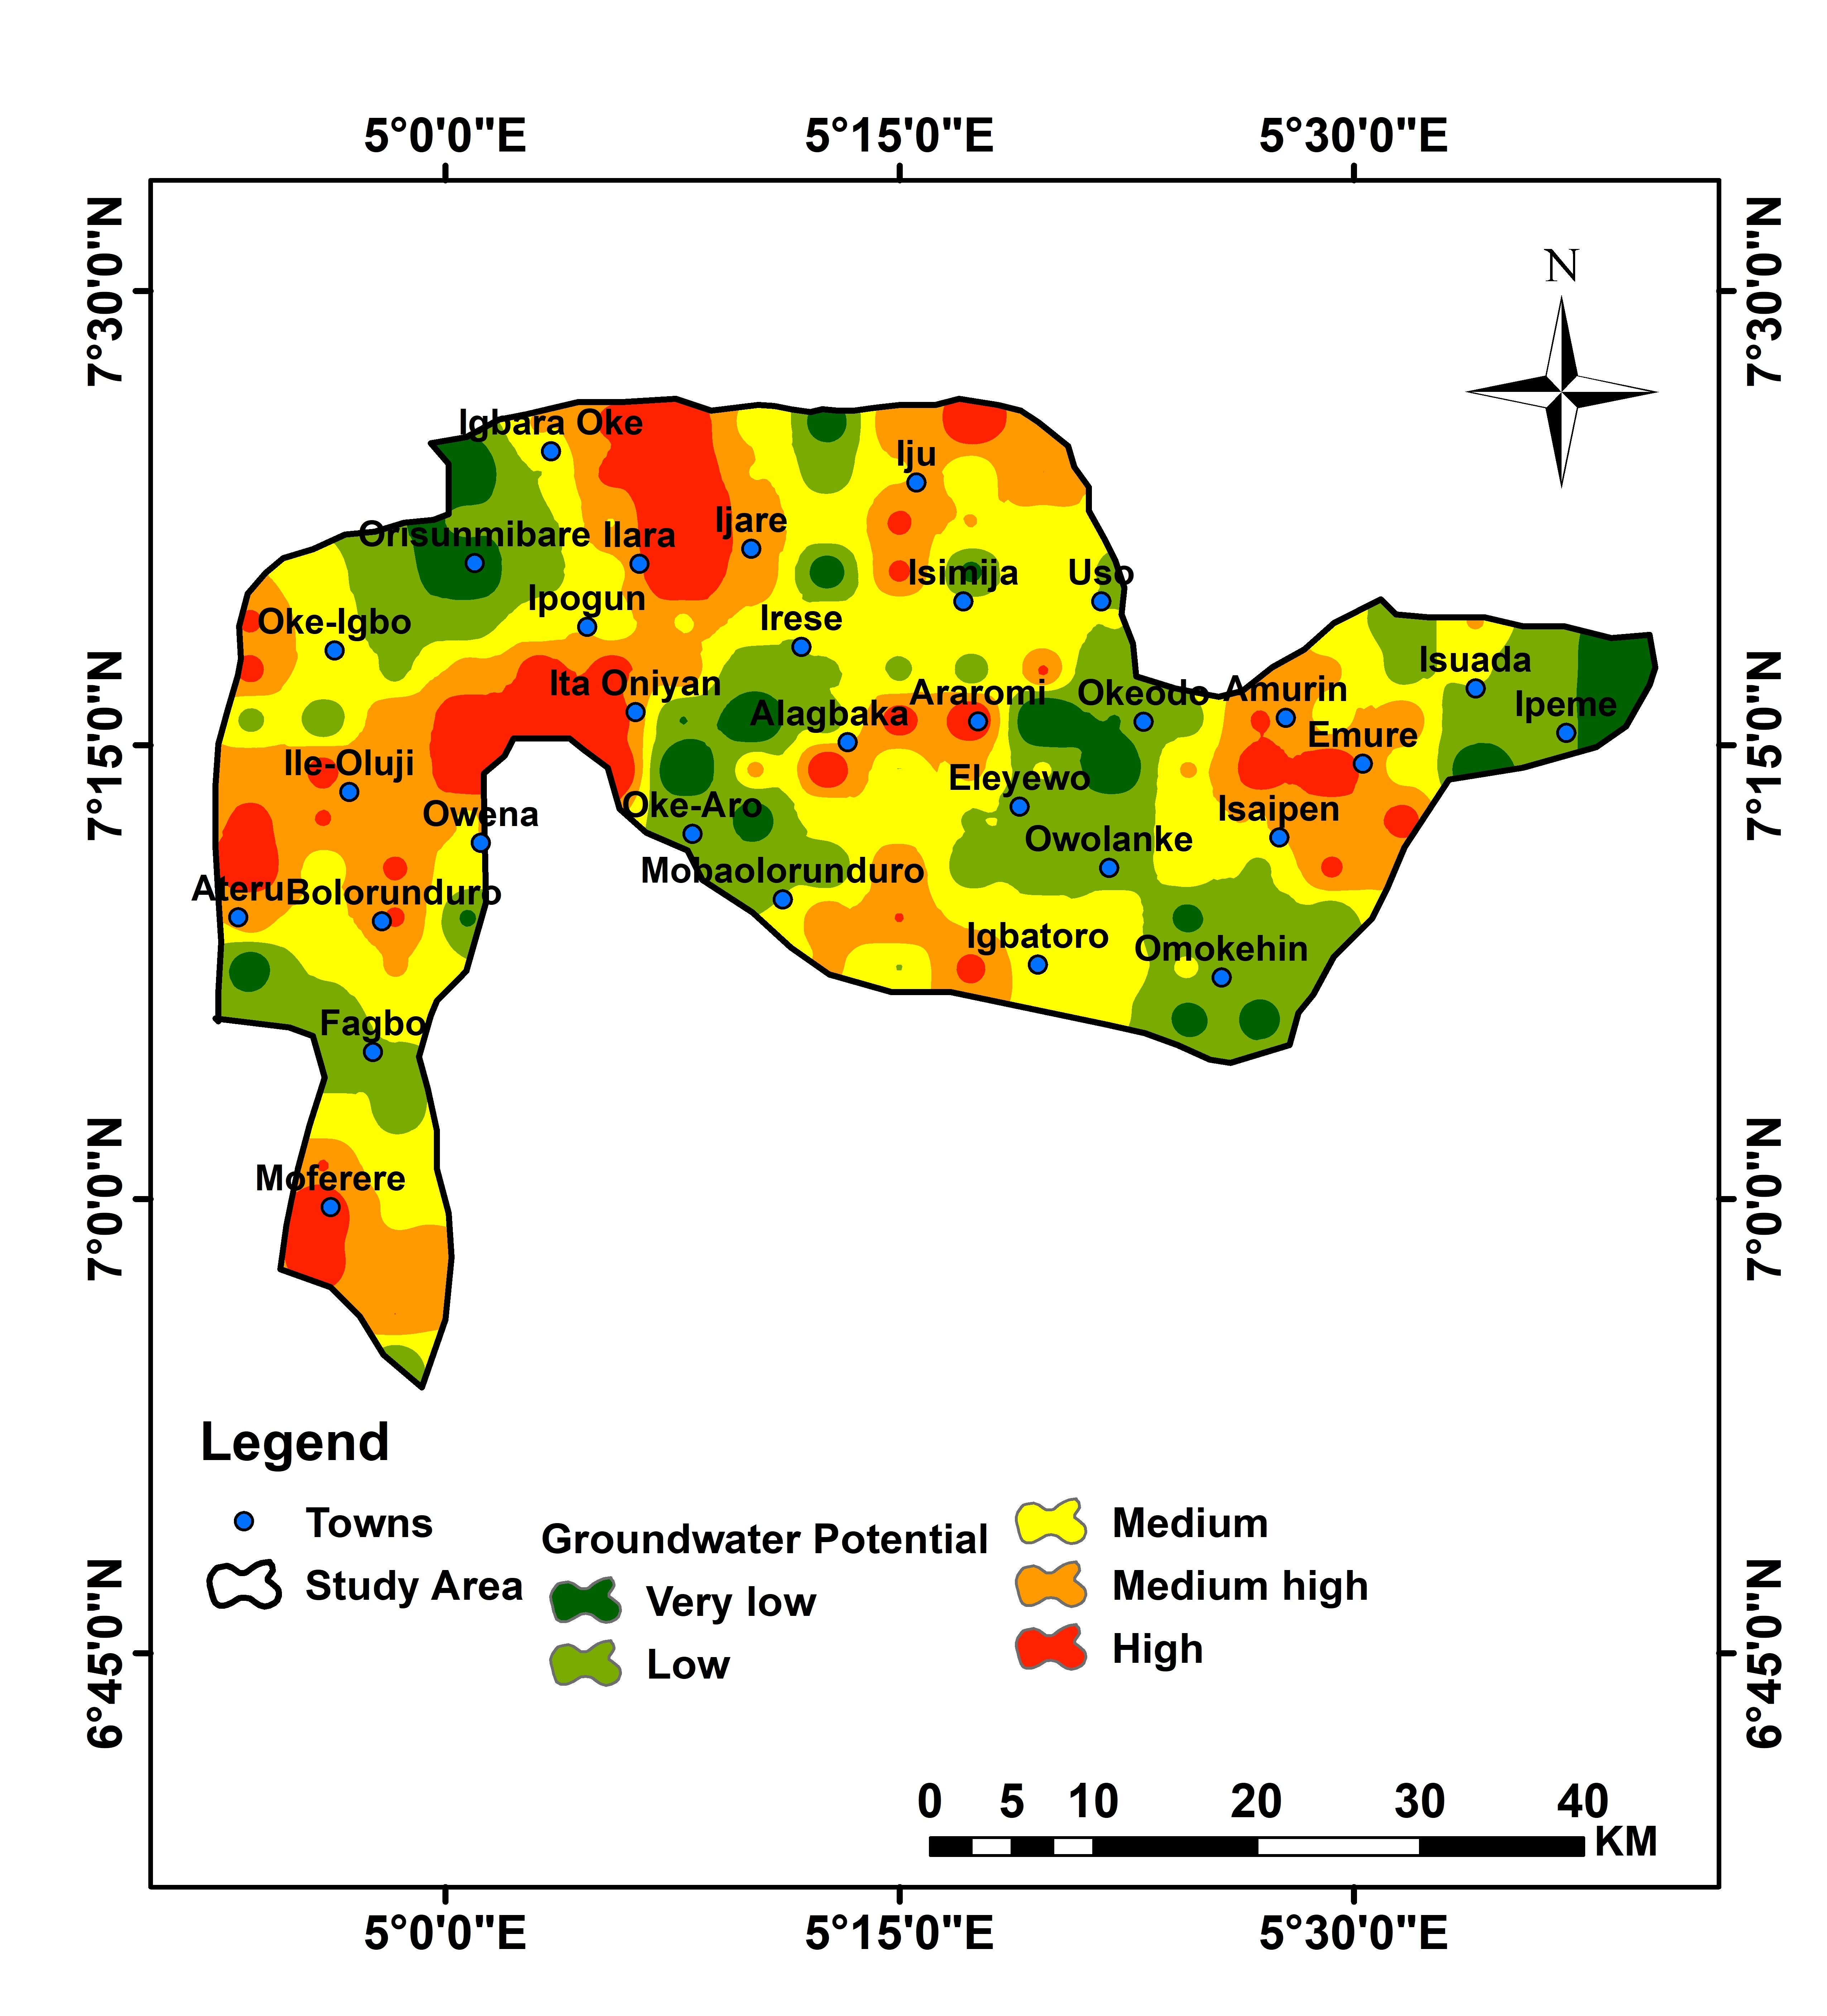
IDOCRIW-CoCoSo showed impressive AUC-score compared to CRITIC and Mean Weighted CoCoSo
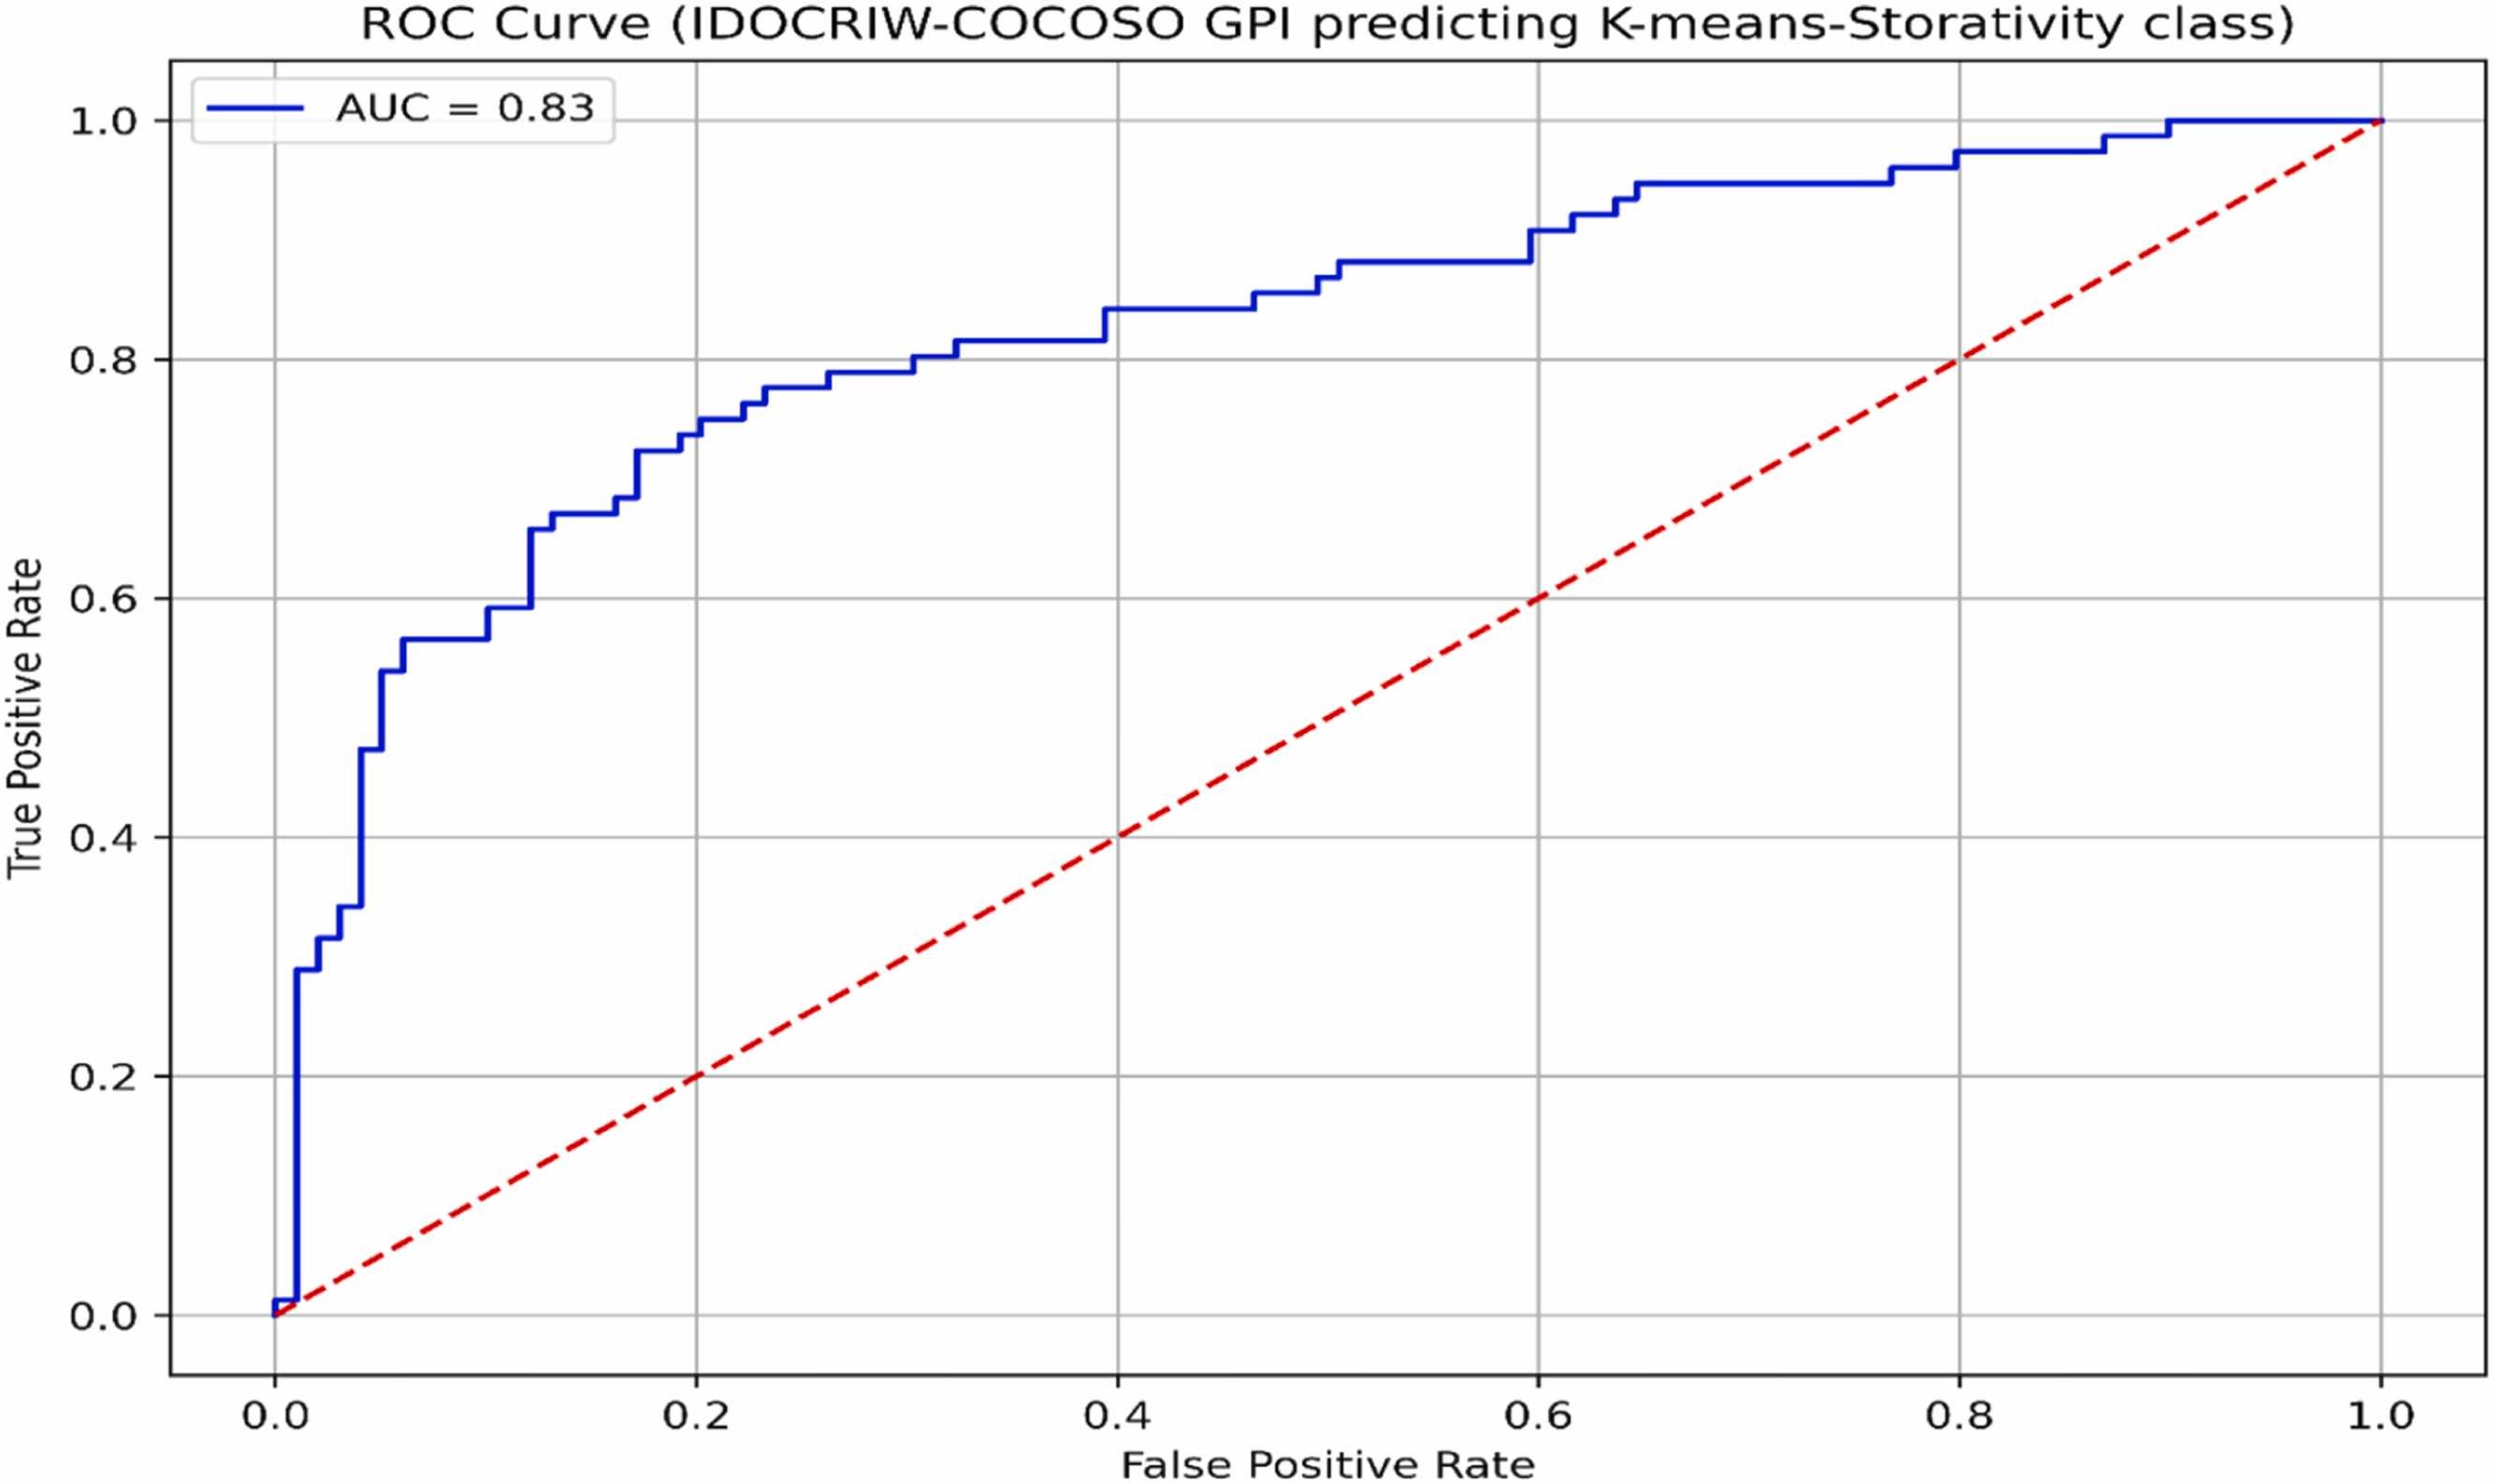
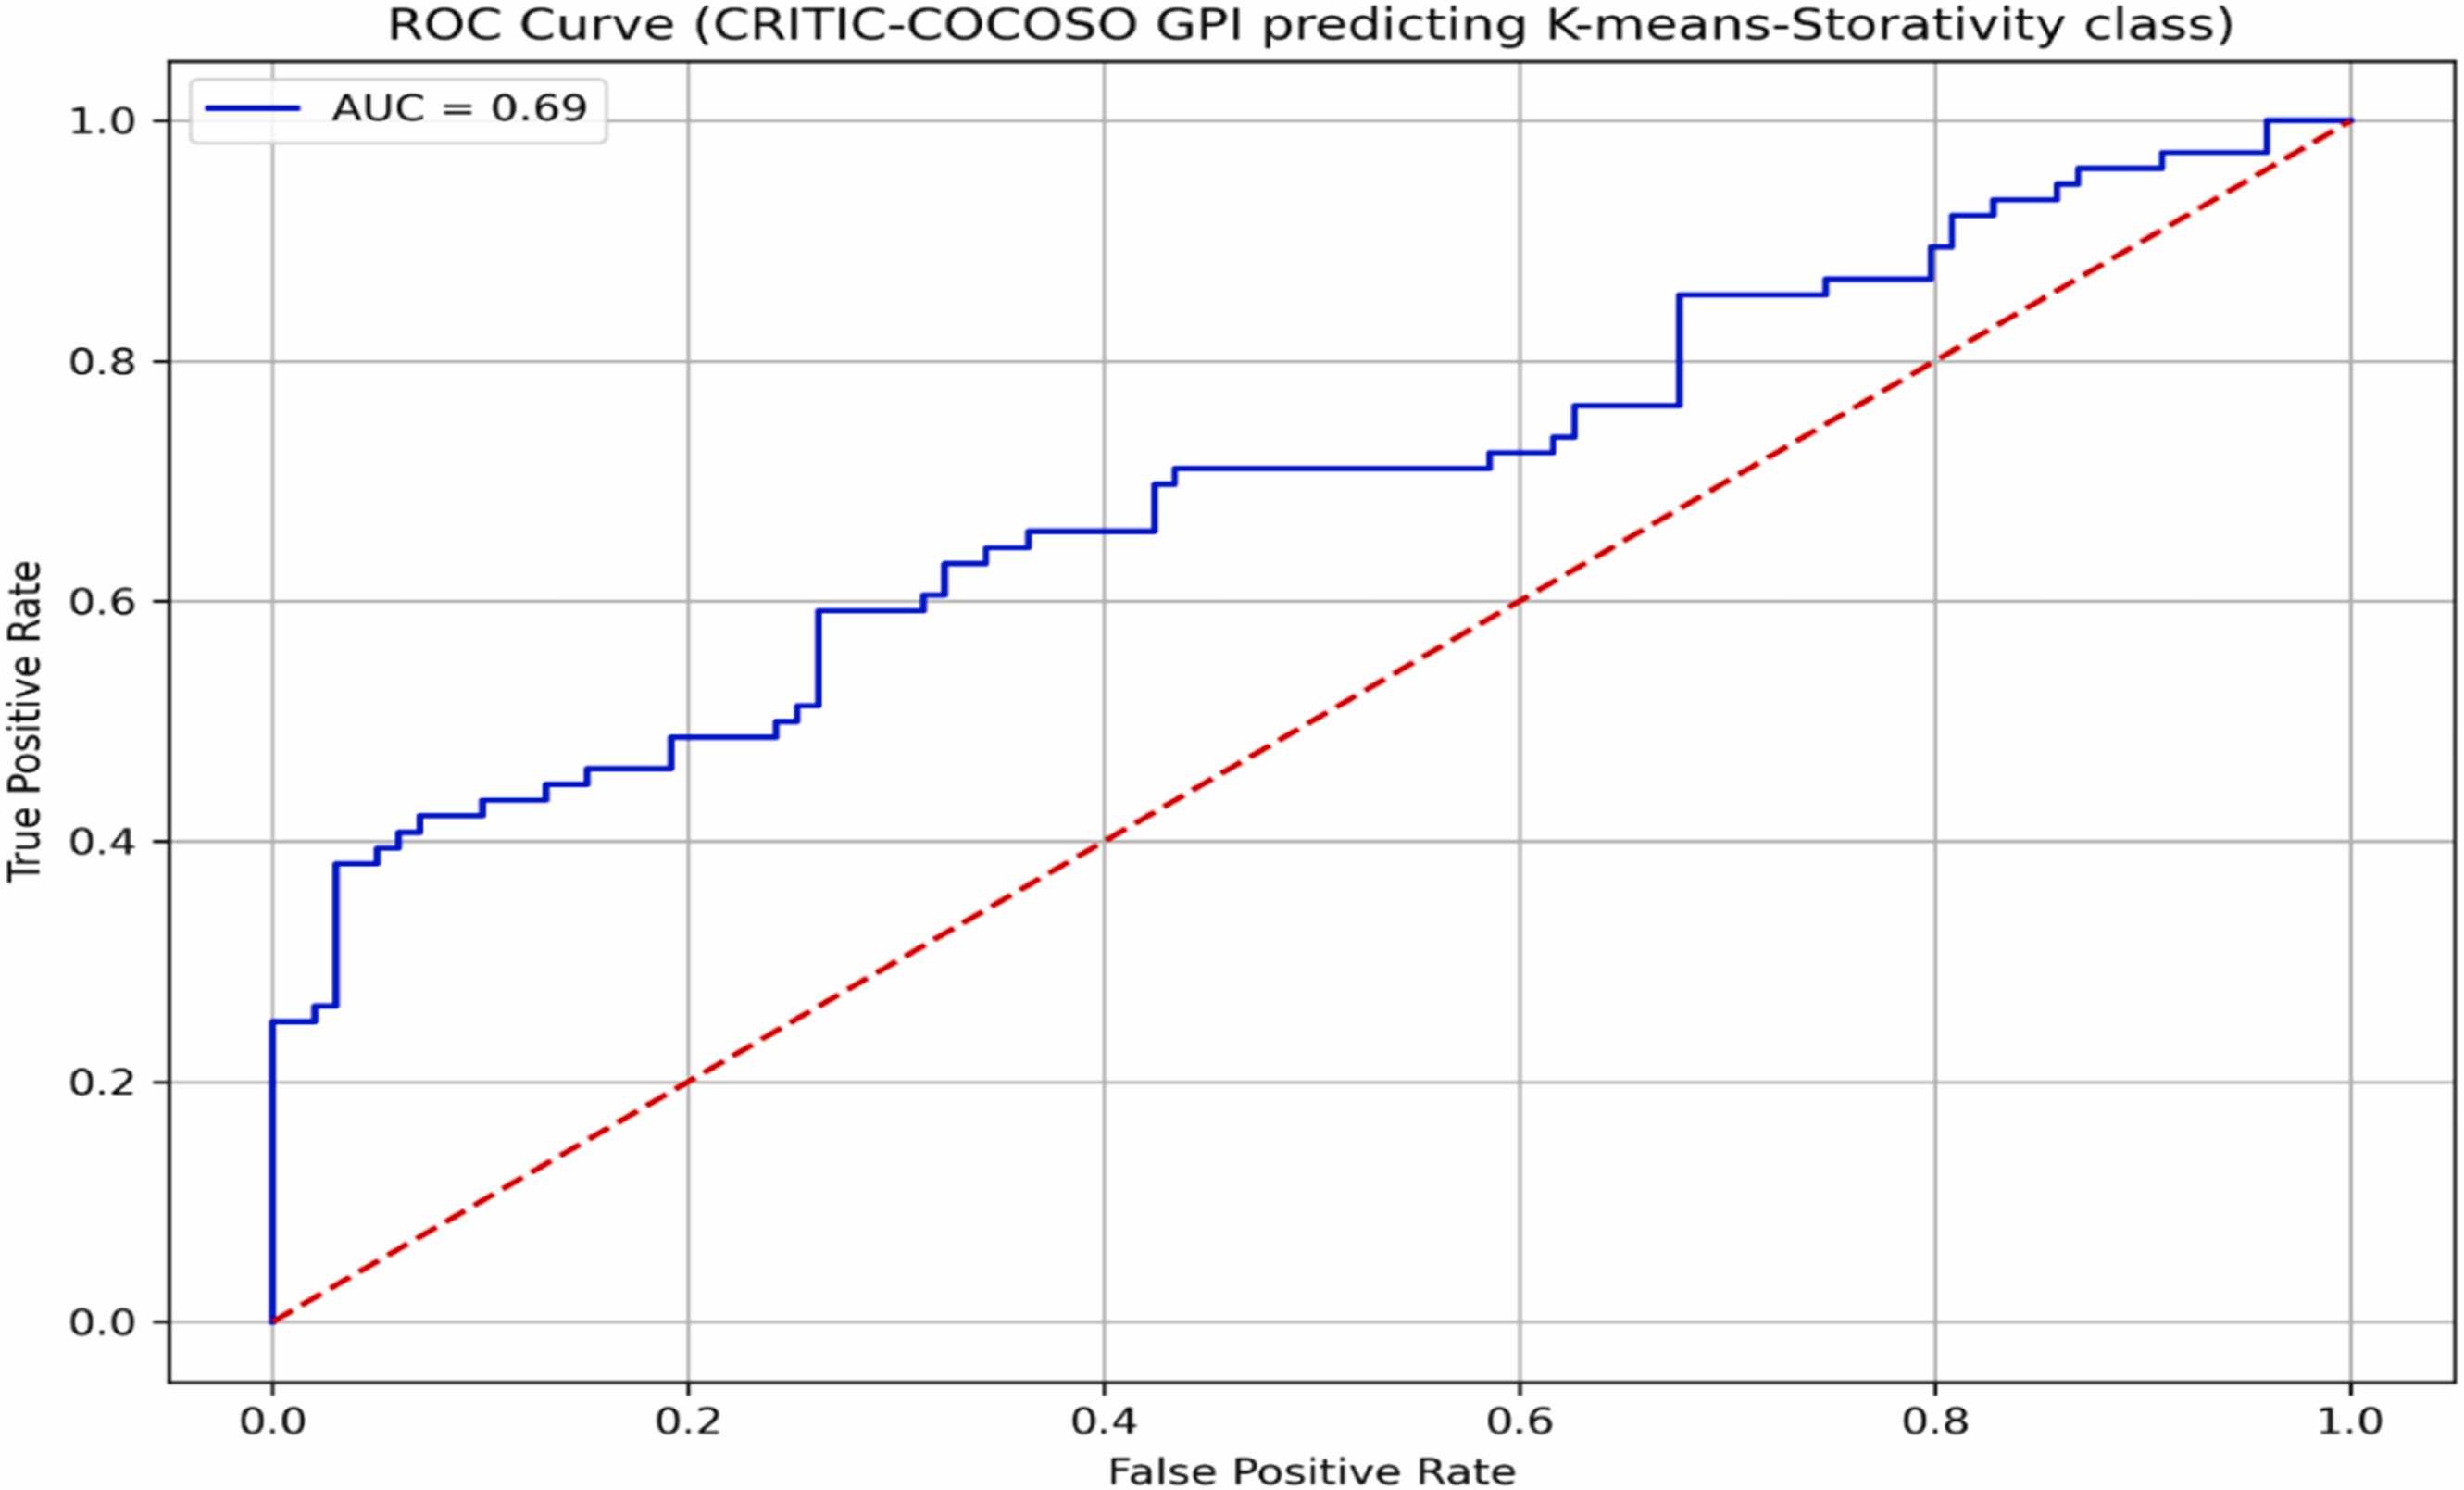
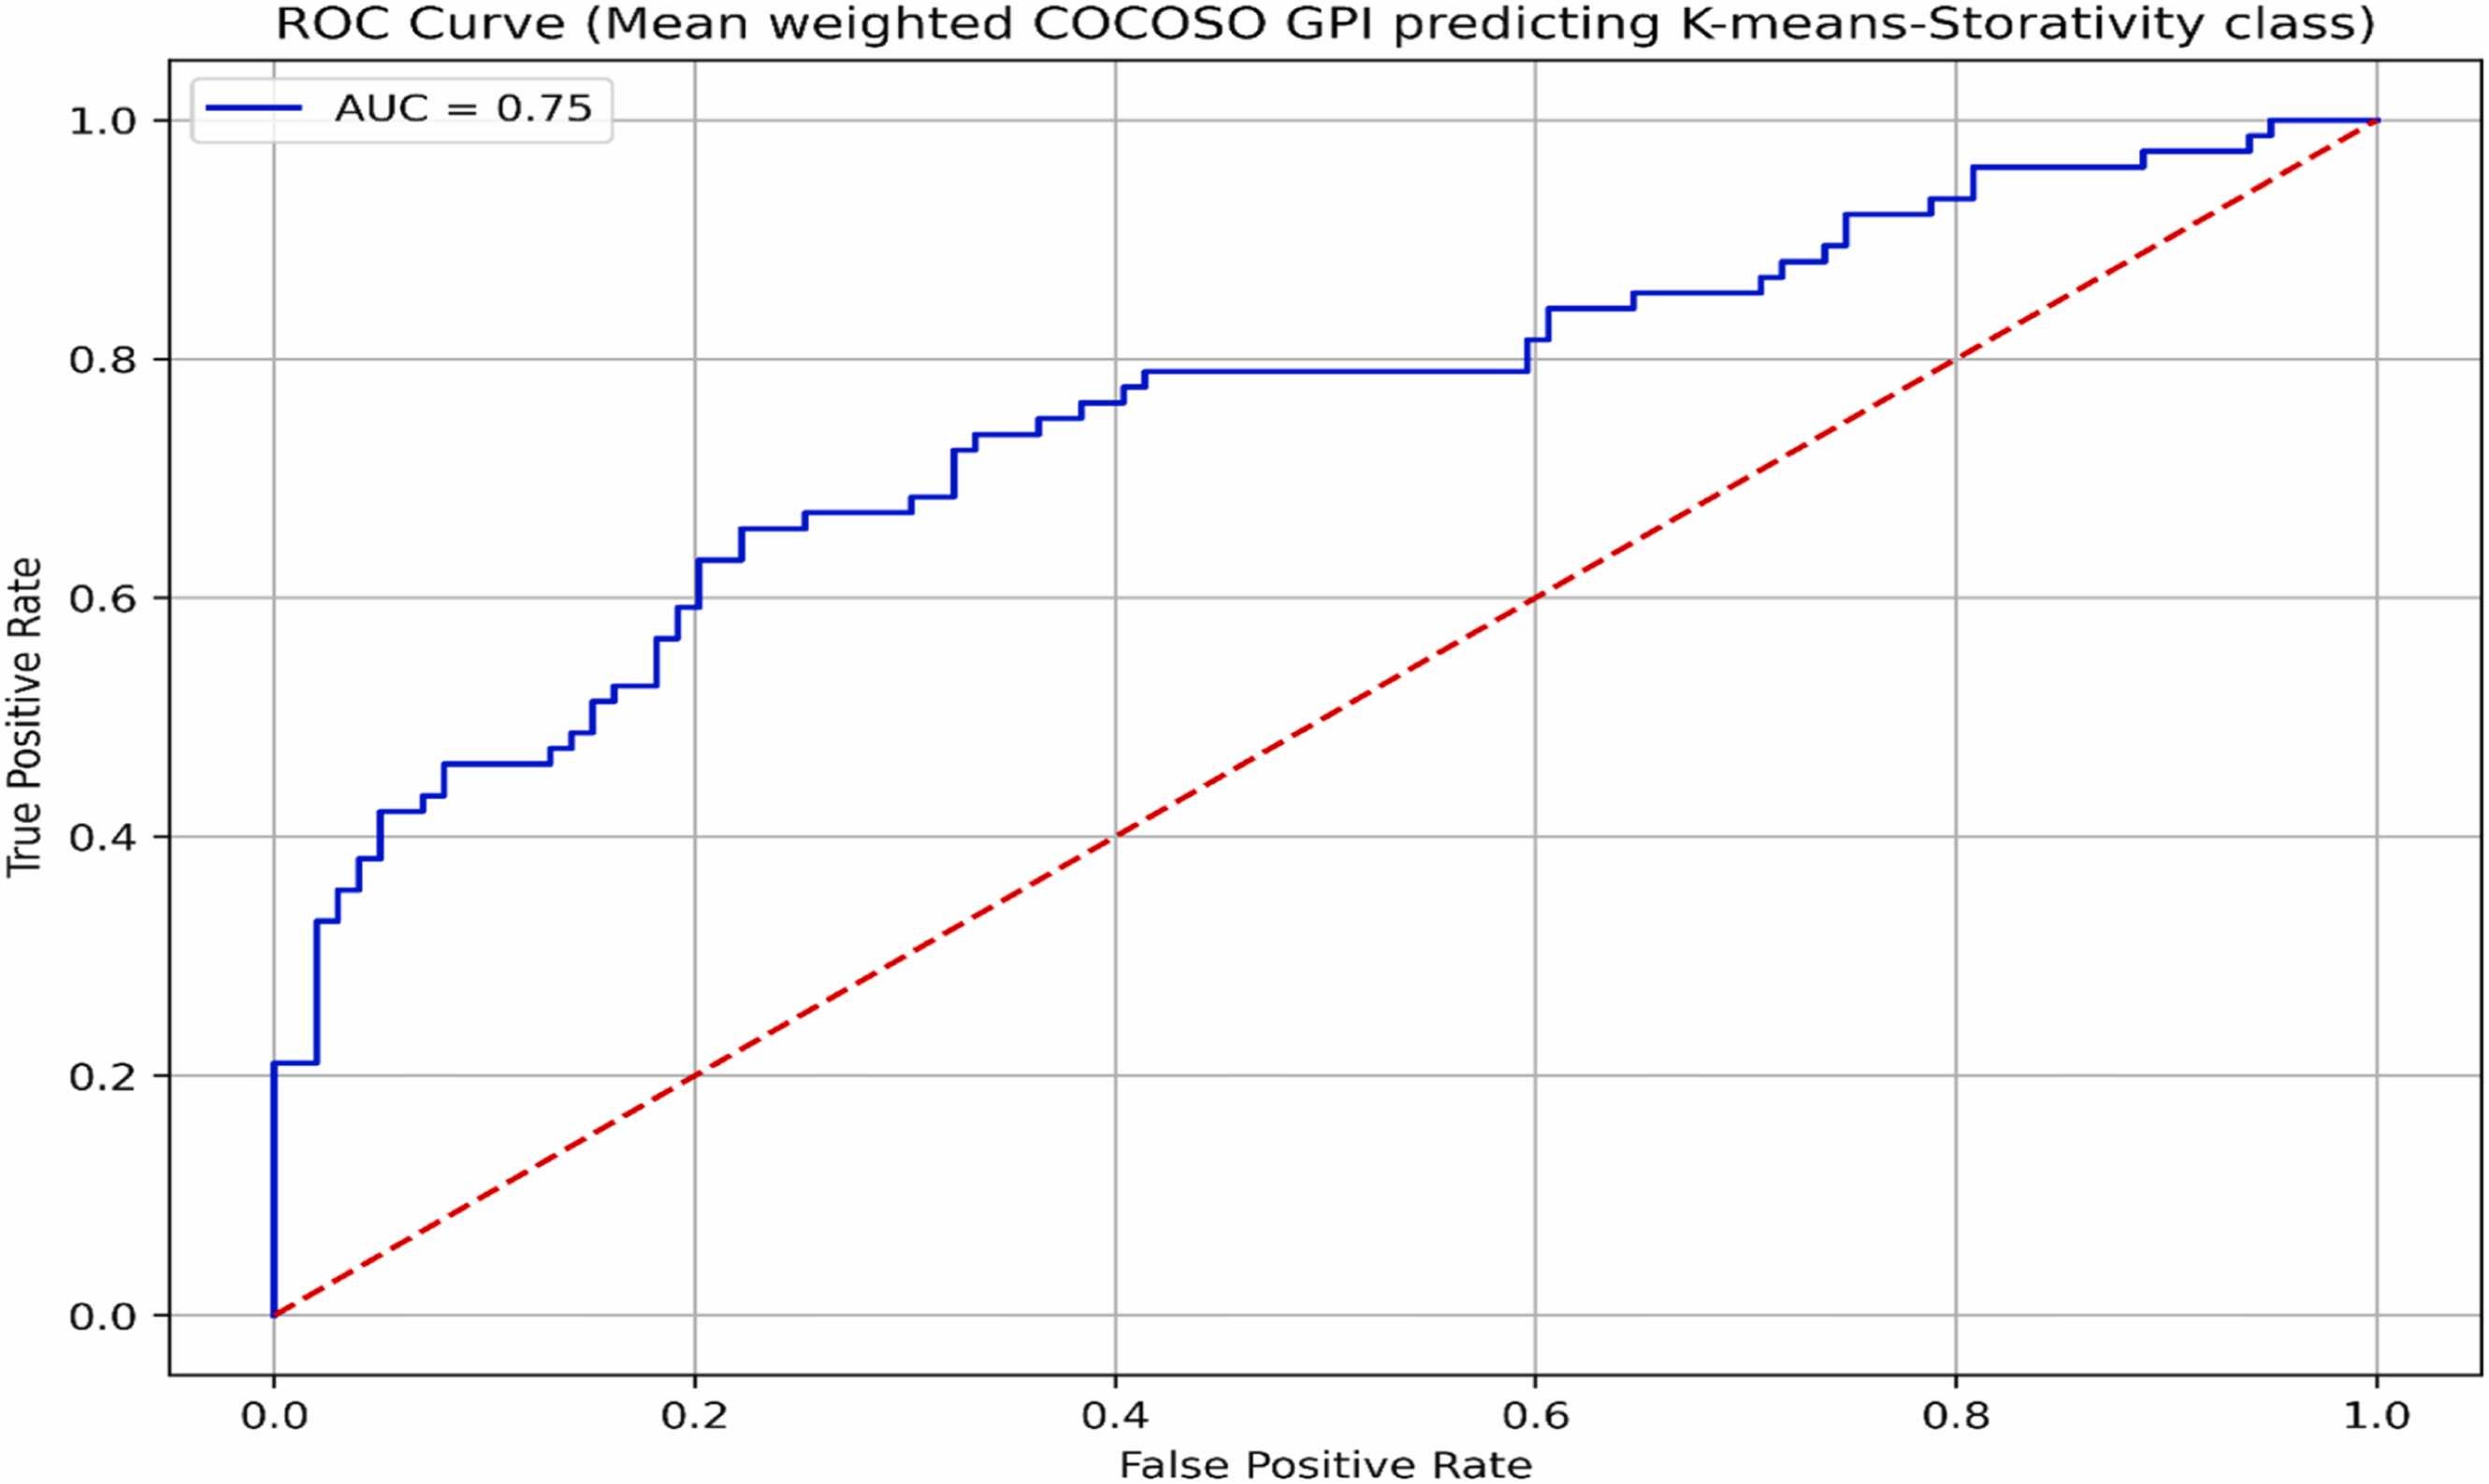
Comparative and hydrogeological analysis further elaborated the supremacy and efficacy of IDOCRIW-CoCoSo model for groundwater potential mapping